


WPPR v6.0 is focused on trying to answer a systemic problem regarding the advantages of access and privilege that certain players have at their disposal, giving themselves more opportunities to compete in IFPA sanctioned events and earn WPPR points towards their ranking at a level that is above and beyond their peers. There’s privilege when it comes to players that live close to more opportunities, and privilege when it comes to players that can afford to travel and create those opportunities for themselves. Ultimately this leads to situations where the accuracy of players we’re attempting to rank is flawed due to the inconsistent level of opportunities some may have over others.
WPPR v6.0 will analyze to what extent the results making up that player’s current world ranking are representative of that player’s skill level when compared to all the events that player has played in over the past 3 years. This analysis will be done by looking at one of the other IFPA player metrics we’ve been tracking for many years, and that’s the Efficiency Percentage (EFF%) metric. This metric will now be an important part of calculating this new “WPPR PRO” ranking.
We will be incorporating a player’s Efficiency Percentage (EFF%) to help define what we’re calling the “WPPRtunity” metric. This is an estimate of the total amount of WPPR’s available that a player played in to generate their top 15 card in determining that player’s world ranking. EFF% = WPPR’s earned/ WPPR’s available for all active events on your resume (not just the events on your top 15 card). This will be used to adjust a player’s WPPR point total into this new WPPR PRO point total.
We will also be incorporating a player’s Strength of Schedule (SOS) to help us analyze a player’s EFF% metric. For players that play in tougher events, the chances of maintaining a higher EFF% metric is harder compared to players that play against easier competition. SOS will be calculated by taking the [Total Active Matches against Top 250 Players / Total Active Matches Against All Players]. For example, Keith Elwin has played 807 matches against the current top 250. He’s played 2372 active matches against everyone. His SOS metric would be 807/2372 = 34.02%.
For players with an SOS metric that is greater than 25%, we will be adjusting that player’s EFF% in the following manner: ADJ EFF% = EFF% * (SOS/25%). For example, Keith Elwin has an EFF% of 60.38%, and an SOS of 34.02%. So he would qualify for an EFF% adjustment –> 60.38% * (34.02%/25%) = 82.17%.
*Please note that for the Women’s WPPR PRO rankings, we will be using the Top 100 Players with a SOS metric of greater than 40%.
To try and help explain things easier, I’ll be comparing two players in these examples, Josh Sharpe (ranked 21st as of this writing) and Keith Elwin (ranked 22nd as of this writing). Some people may say that Keith Elwin is a more skilled player than Josh Sharpe, and that Josh is only ranked higher than Keith because of the massive number of additional opportunities that Josh has had to compete and rack up WPPR points compared to Keith. This analysis of WPPR v6.0 should prove once and for all who is objectively a better player between Josh and Keith.
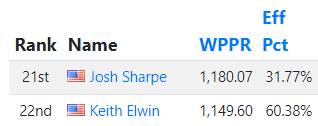
For those not familiar with how EFF% is calculated, let’s break that down for both players.
Josh Sharpe –> Total Active WPPR’s Earned (1568.17) / Total Active WPPR’s Available (4936.01) = 31.77%
Keith Elwin –> Total Active WPPR’s Earned (1264.02) / Total Active WPPR’s Available (2093.44) = 60.38%
For example, if both Josh and Keith attended the same event worth 100 WPPR points to the winner, on average Josh would earn 31.77 WPPR’s from that event while Keith would earn 60.38 WPPR’s.
We’ll be using these stats for both Josh and Keith to show the WPPR v6.0 calculation process below which will determine the WPPR PRO ranking.
STEP 1 → Calculating the “WPPRtunity” metric
This is calculated by taking the total WPPR’s on a player’s card and dividing it by a player’s EFF%.
Josh Sharpe –> 1180.07 / 31.77% = 3714.42
Keith Elwin –> 1149.60 / 60.38% = 1903.94
What this is estimating is that I would have to play in over 3700 WPPR’s worth of events to rack up my 1180.07 total.
This estimate says that Keith would have to play in roughly 1900 WPPR’s worth of events to rack up his 1149.60 total.
Based on this comparison, I would have to play twice as much as Keith in order to get a similar number of WPPR points on my card. This is a data point that supports the claim that Keith Elwin is more skilled at playing competitive pinball than Josh Sharpe and a system that ranks Keith higher would be more accurate.
STEP 2 → Defining what is a reasonable level of “WPPRtunity”
We will be calculating this WPPRtunity metric for every player in the top 250, finding an average across those players. This average WPPRtunity value will be used to help calculate an adjustment to a player’s WPPR point total, creating a WPPR PRO list for the top 250 players after this v6.0 adjustment is made.
For the purposes of this example, we’re going to use 1500.00 as this average WPPRtunity value.
Anyone that has a WPPRtunity value 1500.00 or below would keep all of their existing WPPR points in their resume at full value.
Anyone that has a WPPRtunity value higher than 1500.00 will have a certain percentage of the WPPR points in their resume awarded at the value of the EFF% rather than at full value.
STEP 3 → Calculate the percentage of a player’s WPPR point total that will be adjusted to create their WPPR PRO point total
This is calculated by taking the Player’s Excess WPPRtunity Amount over Average / Players WPPRtunity Value
Josh Sharpe –> (3714.42-1500)/3714.42 = 59.62%
Keith Elwin –> (1903.94-1500)/1903.94 = 21.22%
59.62% of the WPPR’s on my resume would be subject to this adjustment, with that adjustment being based on my EFF%.
STEP 4 → Calculate the WPPR PRO point total by applying this adjustment
This is calculated by taking the Player’s WPPR point total * the percentage of those WPPR’s to be adjusted * 1-EFF%
Josh Sharpe –> 1180.07 * 59.62% * 68.23% = Adjustment of 480.04 WPPR’s –> WPPR PRO total of 700.03 WPPR PRO Points
Keith Elwin –> 1149.60 * 21.22% * 39.62% = Adjustment of 96.65 WPPR’s –> WPPR PRO total of 1052.95 WPPR PRO Points
Josh Sharpe –> WPPR RANK = 21st, WPPR PRO RANK = 32nd (down 11 spots)
Keith Elwin –> WPPR RANK = 22nd, WPPR PRO RANK = 11th (up 11 spots)
While this is just one example, a more general way to explain this is to take Player A that believes they are a mediocre level player that tends to feel like they get lucky every once in a while.
They’ll play 10 events, have a great showing in one of them due to some version of ‘everything fell into place for them’ at that event (some combination of skill/luck/etc).
Now take that same player and have them play in 200 events.
The old system ranks this person based only on the 15 events where ‘everything fell into place for them’.
The new system looks at that person and asks the question, what amount of play did this player play in to earn that wonderful top 15 card?
For a player that gets some version of “lucky” 10% of the time they play, the adjustment can be quite impactful. For a player that is more consistent across their entire active body of work, the adjustment can be little to nothing.
There is a sample worksheet showing this WPPR v6.0 calculation HERE.
For those looking to increase their WPPR PRO rank, this can be done by increasing the WPPR’s on your top 15 card as well as increasing your EFF%.
A reminder that only the top 250 players in the world are included in the WPPR PRO rankings. As of this current simulation 128 players will see their WPPR PRO ranking increase compared to their WPPR ranking, while 114 players will see their WPPR PRO ranking decrease compared to their WPPR ranking. 66 of the 250 players will see no adjustment made based on the WPPR v6.0 calculation based on their WPPRtunity level being below average.


